Filterable logs and health metrics for custom apps are now in the Developer Dashboard
By Steven Van ·
Shopify's Developer Dashboard adds filterable logs and health metrics so developers can diagnose custom apps without their own instrumentation.
The Shopify Developer Dashboard now shows how a custom app is performing, not just how it's configured. Opening a custom app surfaces its API request volume, error rates, webhook delivery health, and embedded admin page load speed, each measured against a clear threshold so a developer can tell good from bad at a glance.
- A single filterable stream holds every API request, webhook delivery, and app event, making it possible to find the cause when an app stops working.
- A new home page shows what needs attention across all of an organization's apps.
- Agencies and developers who build custom apps see the same data.
The new experience is at dev.shopify.com/dashboard, with more detail in the announcement.
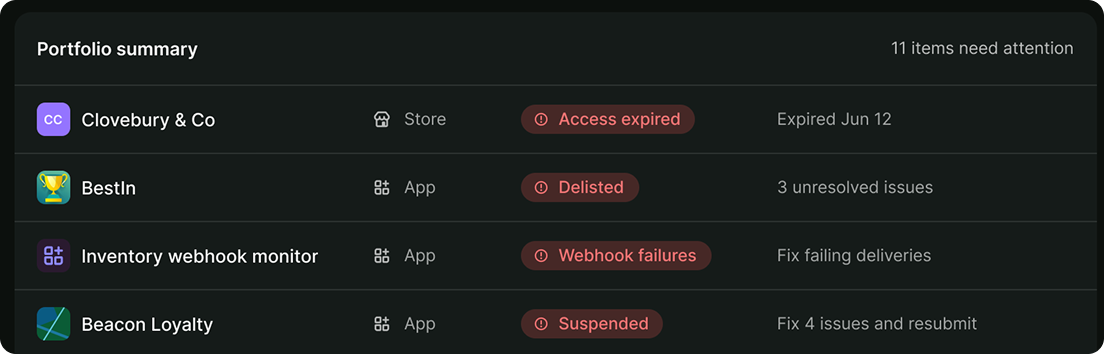
Home page's Portfolio card listing apps and stores needing attention, with alert status.
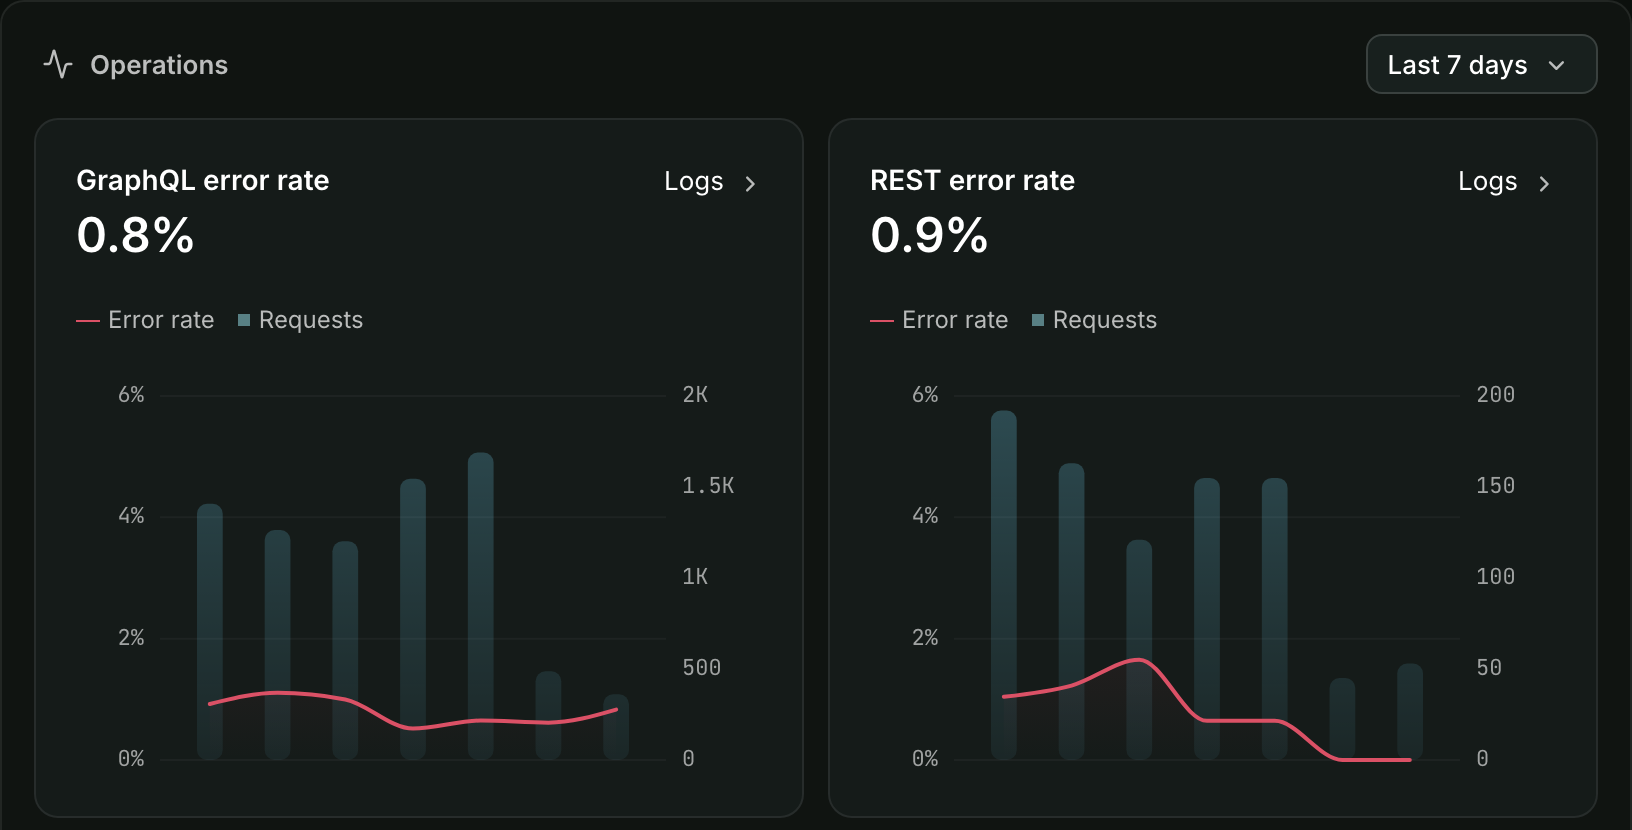
An app's Operations card charting error rates against request volume, linking into Logs.

Shopify
Build and run an online store — e-commerce platform with themes, payments, inventory, and AI tools for creators selling products.
View Shopify →