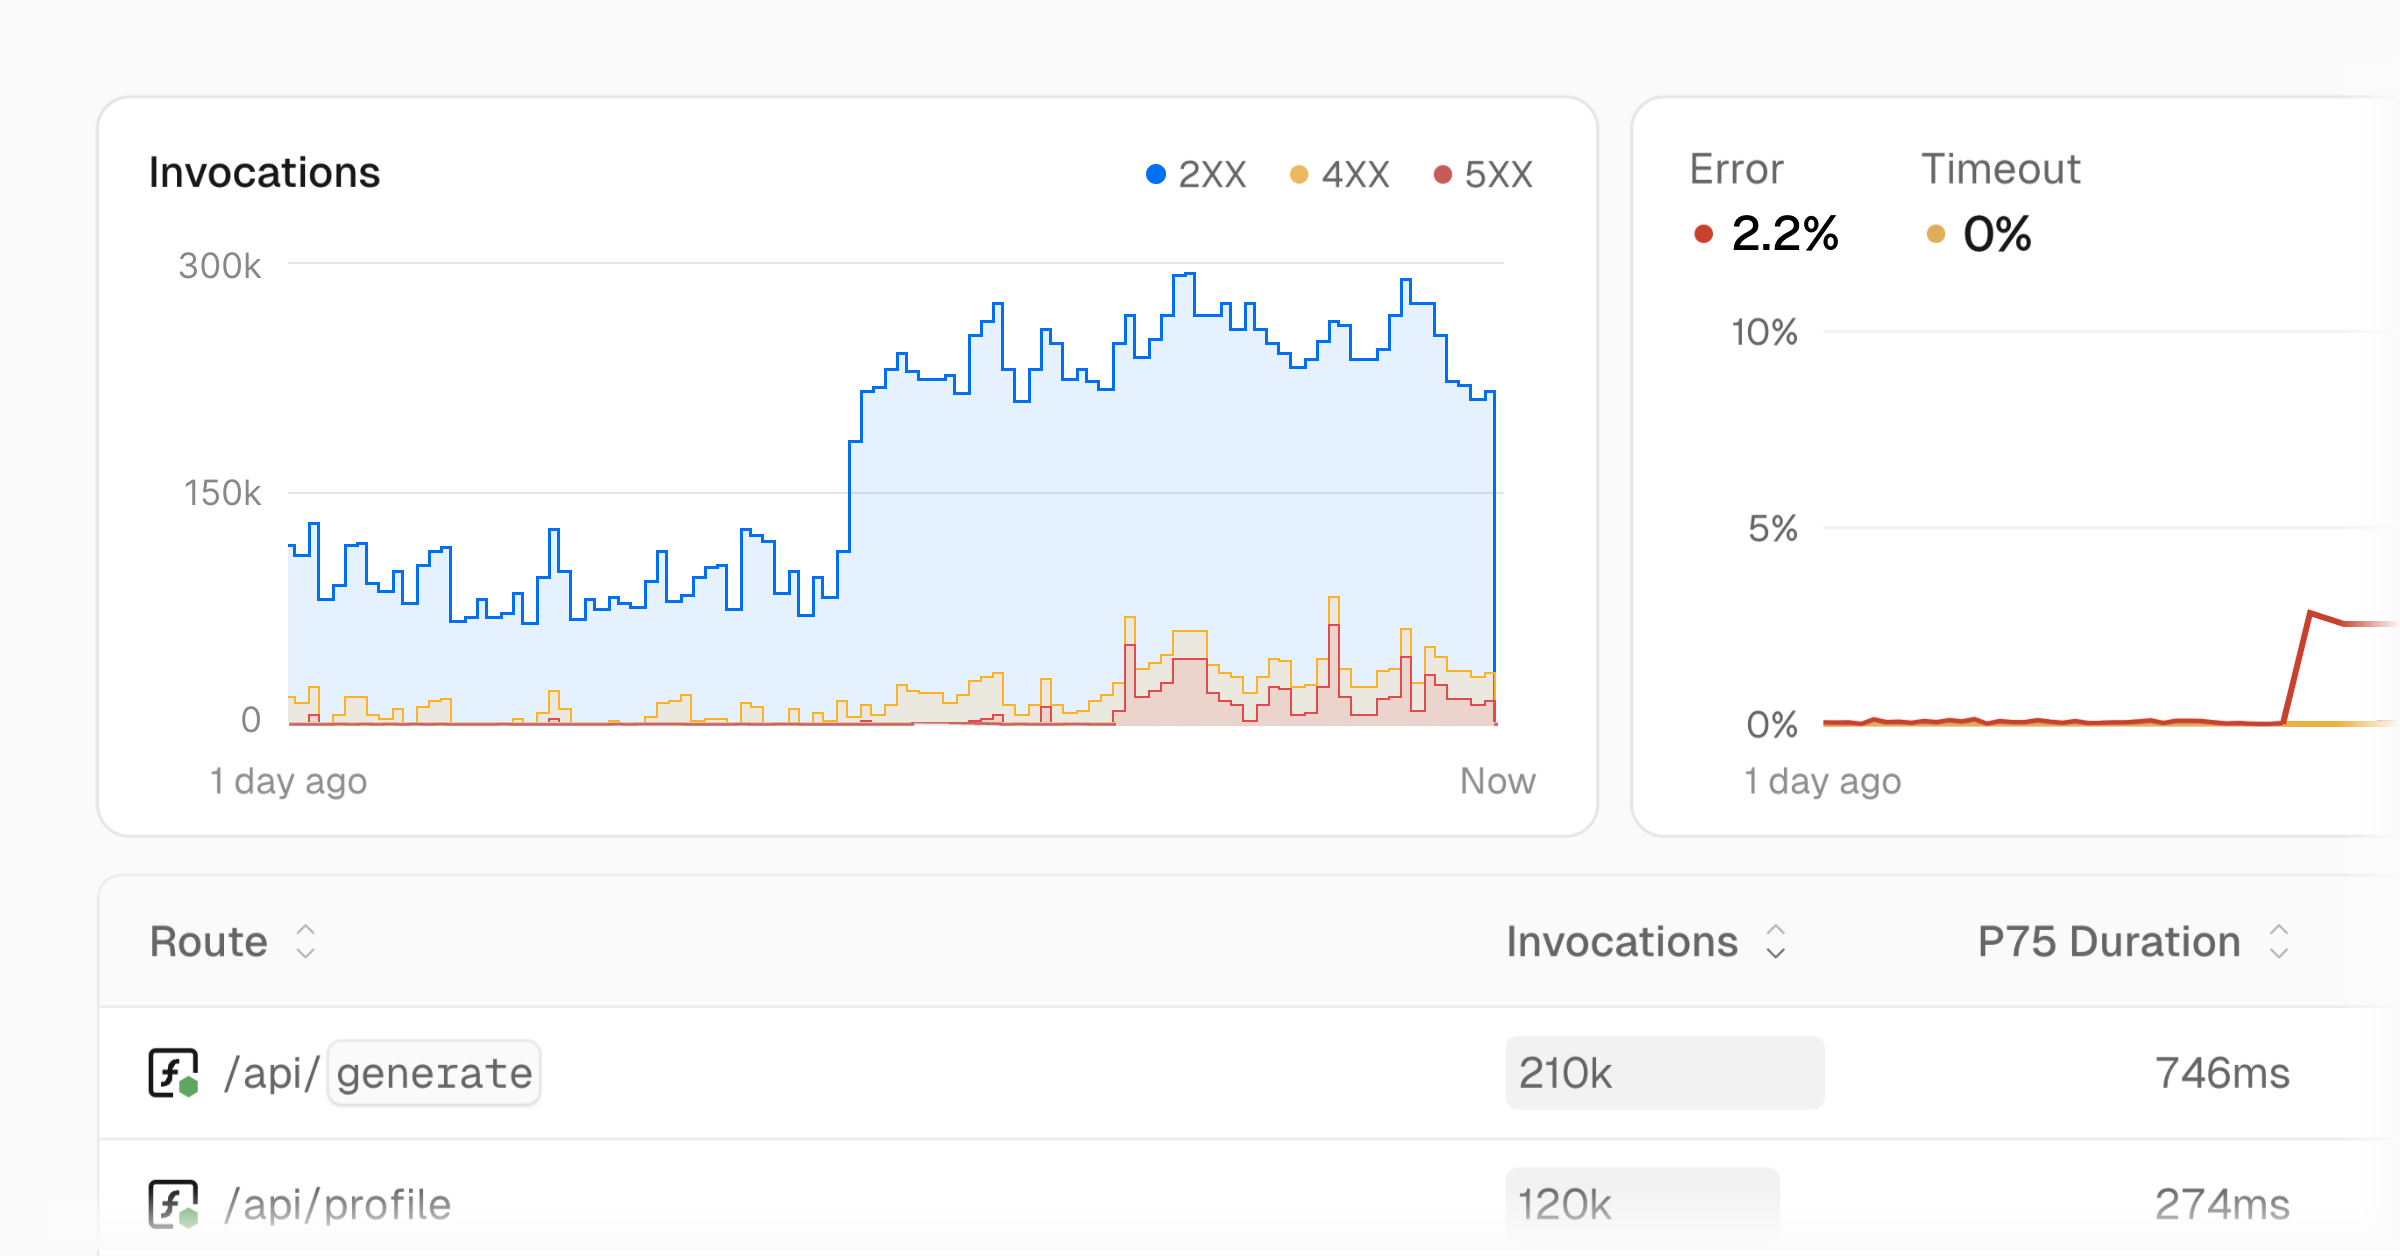
Overview page in Observability
By Steven Van ·
The new dashboard summarises requests, data transfer and function performance, with one-click links into the detailed Observability views.
Vercel Observability now has an overview page that gives a high-level view of an application's performance. It pulls together key metrics from Edge Requests, Fast Data Transfer and Vercel Functions, showing request and data transfer volumes alongside function performance.
Each metric links with one click to its own dashboard for more detailed analysis. The page is in the Observability dashboard, and Vercel describes it in its Observability documentation. Observability is available on all plans, with Observability Plus on Pro and Enterprise teams adding more metrics, higher limits and longer retention.