Introducing Vercel Drains: Complete observability data, anywhere
By Steven Van ·
Vercel's log drains are renamed Drains and now also export OpenTelemetry traces, Web Analytics, and Speed Insights on Pro and Enterprise plans.
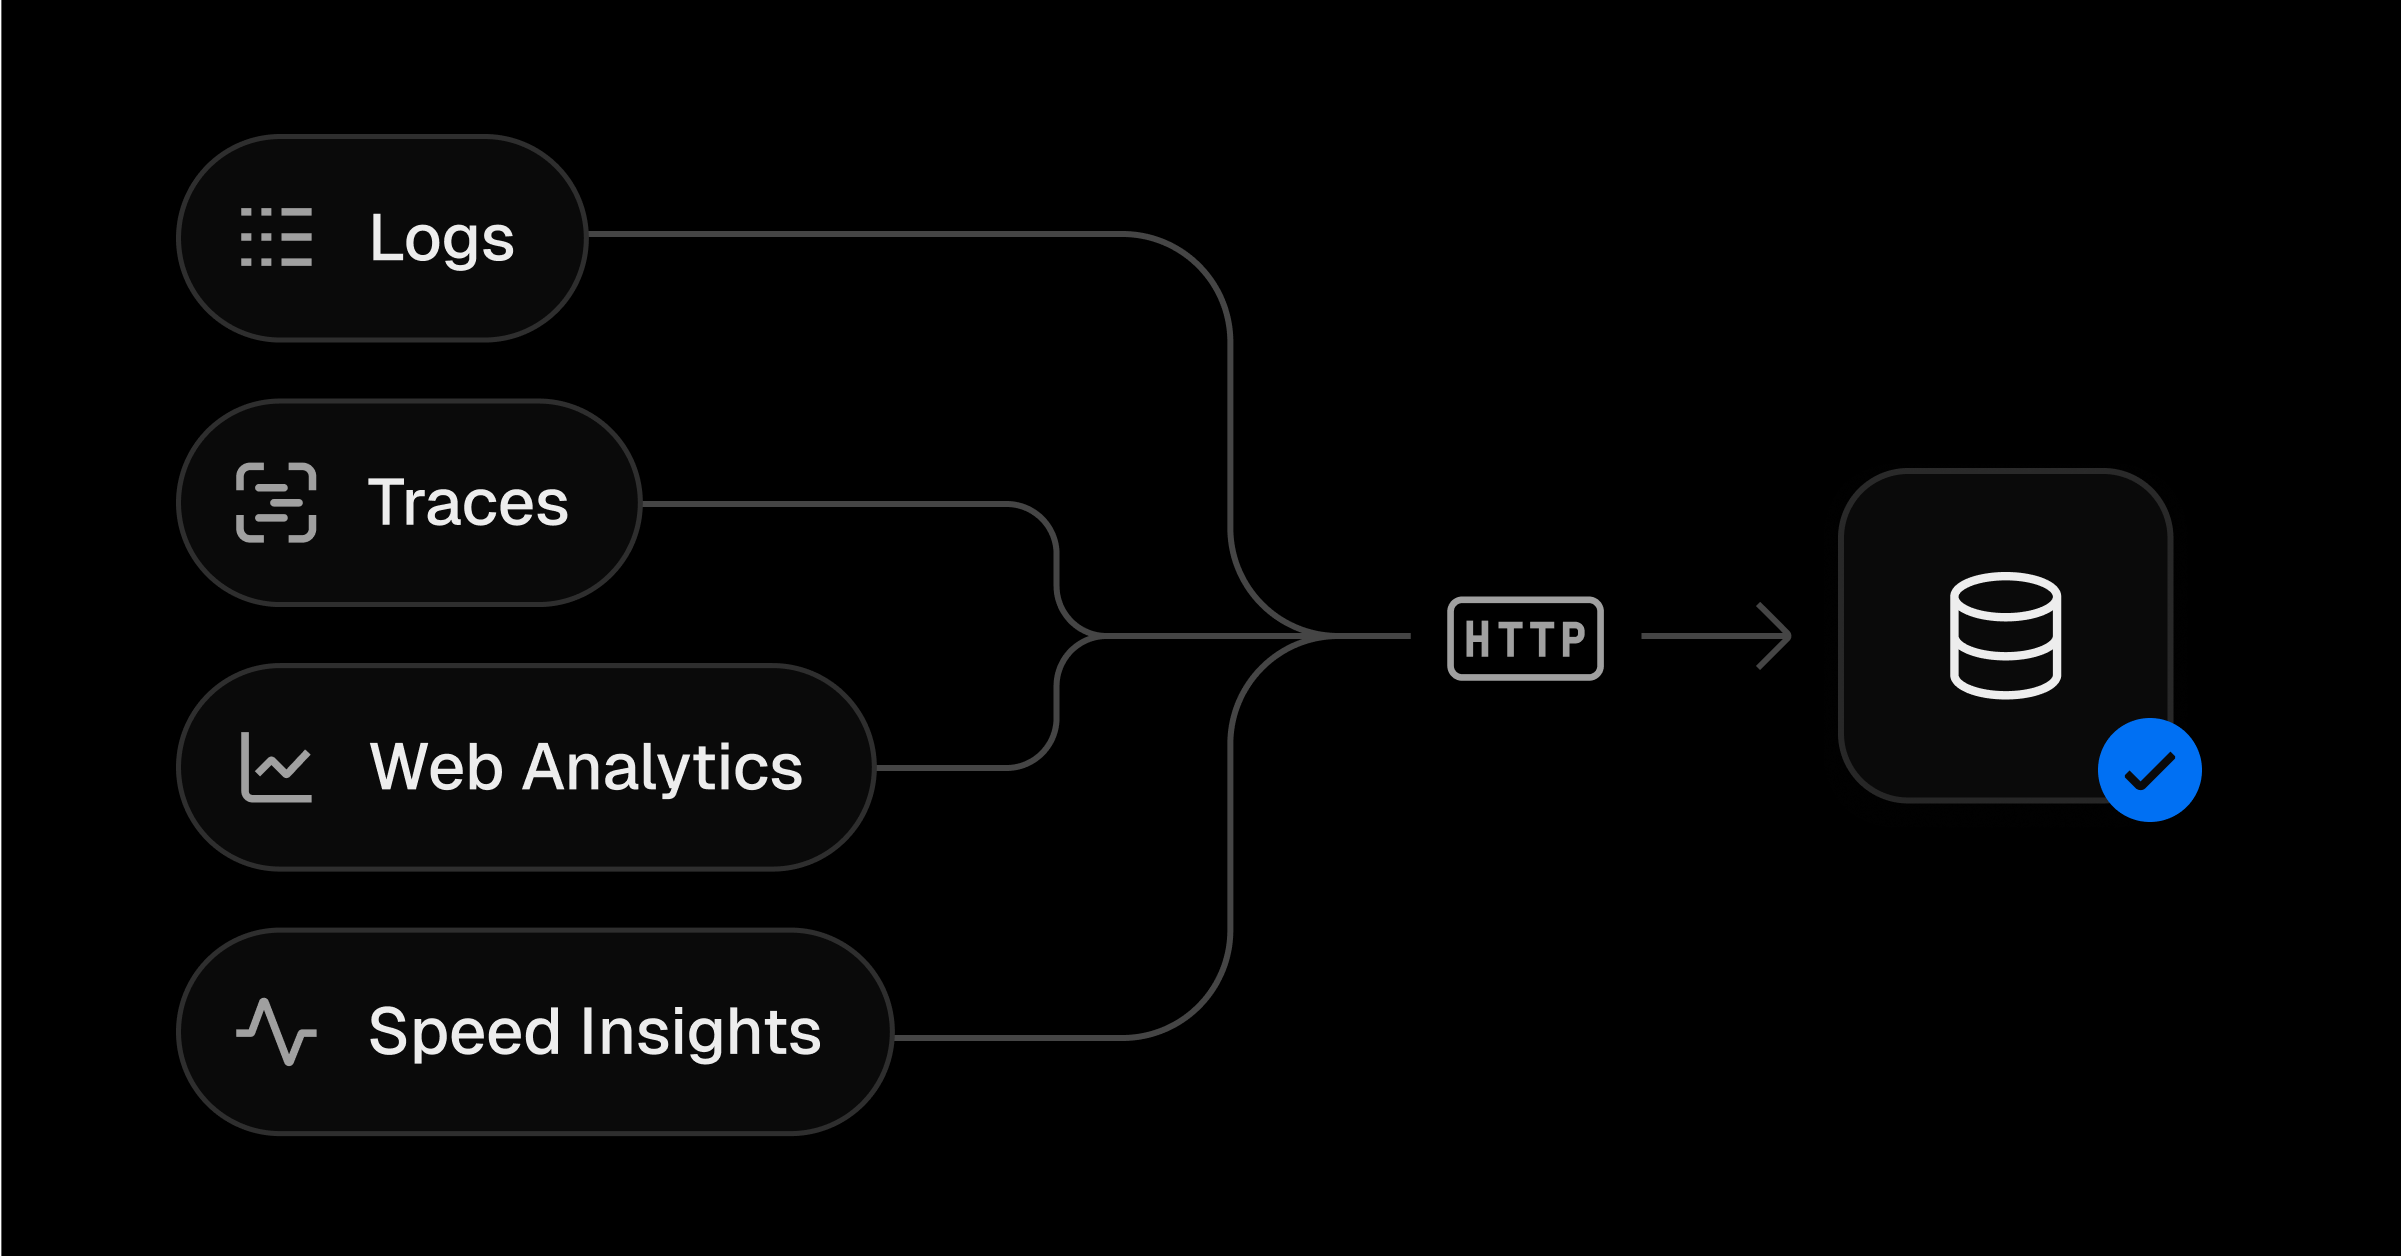
Vercel Log Drains are now Vercel Drains, extended beyond logs to also export OpenTelemetry traces, Web Analytics events, and Speed Insights metrics through one pipeline.
- Logs: runtime, build, static asset, firewall, and function logs.
- Traces: distributed tracing data forwarded from deployments via OpenTelemetry, compatible with Datadog APM, Honeycomb, Grafana Tempo, New Relic, and other OTel vendors.
- Web Analytics: page view and custom event data.
- Speed Insights: real-user performance metrics and Web Vitals.
Logs from traced requests are automatically enriched with a traceId and spanId, linking a log line to the distributed trace it belongs to. Drains come in two forms: custom drains to any HTTP endpoint, with a choice of data type, sampling rate, format (JSON, NDJSON, or Protobuf), and headers or signature verification; and integration drains with turnkey vendors including Dash0, Statsig, Datadog, and Logflare. Drains are available now on Pro and Enterprise plans, billed at $0.50 per GB, the same rate as existing log drains, with multiple drains configurable per team across projects. They can be set up from the Vercel dashboard under Team Settings → Drains.